

A new blog post has been a long time coming (we’ve been busy! me doing some training, work and the addition of a little girl and Prof writing a book), and with Ironman NZ behind us for another year, it’s given me the chance to write something I’ve been wanting to express for some time.
I love a bit of social media interaction. Whilst I’m not the most vocal, I do enjoy keeping an eye on the latest hot topics in the world of endurance sports and Ironman Triathlon. Over the past few months or so, “polarized training” has become a real buzz word in the triathlon training world. Particularly Ironman. But is this really the best way to train when considering an event like Ironman? Here is a spin on it from Plews and Prof.
Training intensity distribution and polarised training
When we refer to training intensity distribution (TID), we are talking about how much of the time we spend in low, moderate and high training intensity zones.
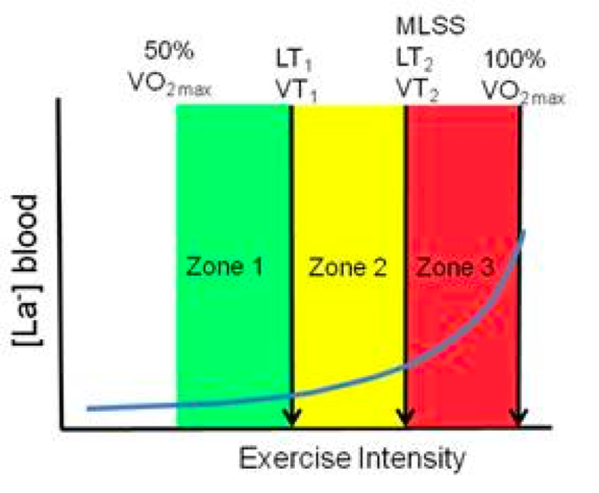
Figure 1 shows a great illustration of the zones we’re talking about from the father on the topic for us, Professor Stephen Seiler, which I’ll use throughout this essay. Have a read of his 2009 paper if you want to really geek out. In a nutshell, there are generally two main models of TID that have dominated the literature. These are namely the polarised (1) and the threshold (2) models of training. The polarised model was first described within the training performed by the East German system from 1970-80, whereby a high volume of low-intensity training appeared balanced against regular application of high-intensity training bouts (~90% to >100% VO2max). This was partially confirmed in 2004 by Fiskerstrand & Seiler (1), who showed a “polarized” pattern of training also when they explained the training and performance characteristics of 28 international Norwegian rowers developing across the years 1970-2001. This polarised model is said to be described as performing about 75-80% of your training at a low intensity (<2 mM blood lactate), 5% at threshold intensity (~4 mM blood lactate), and 15-20% at high intensity (>4 mM blood lactate) (3). This training organization contrasts the classic threshold model (~57% low intensity, 43% threshold, 0% high-intensity (4)) of endurance training, whereby large volumes of mid-zone threshold work is thought to be optimal (2). This former study on world class international rowers provided evidence to support the importance of the polarized training model for endurance athletes striving to be the best in the world, and subsequently has been largely adopted by athletes across many endurance sports. (5,6)
Iron distances races: Racing in the black hole
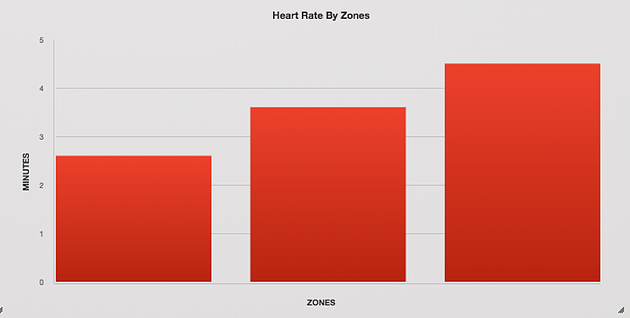
What’s very interesting about the polarized training method as it relates to Ironman, is that most of the research has been carried out in sports where race pace intensity is above the second (“anaerobic”) threshold. Sports like rowing 7 for example, (where much of the TID research has been done), is closer to VO2max intensity. To illustrate, Figure 2 shows an example of the typical intensity breakdown over a 2 km rowing race (split into the three-zone model), where the majority of time spent during the 6-8 min race is above the heart rate associated with the anaerobic threshold. Even in a cycling road race there would be substantial amounts of time spent in the low intensity bandwidth (below the first aerobic threshold, whilst sat in the peloton), alongside shorter times spent above the second threshold (closing gaps, making breaks etc.).
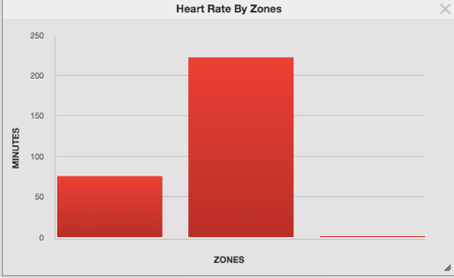
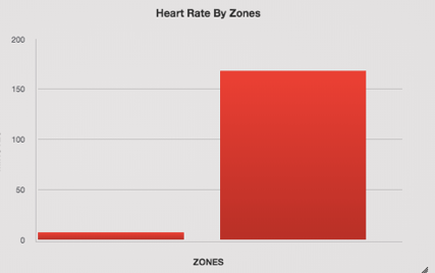
Comparatively, the intensity distribution of Ironman racing is vastly different, with most of the time being spent in the moderate intensity bandwidth. Figure 3 shows my HR distribution during the Taupo 70.3 event in December 2017. From this, its clear that most of the ~4h race duration is spent at a moderate exercise intensity. To take this a step further, we can look at my race for Ironman New Zealand 2017, where there is even more time spent in the moderate intensity heart rate bandwidth (Figure 4).
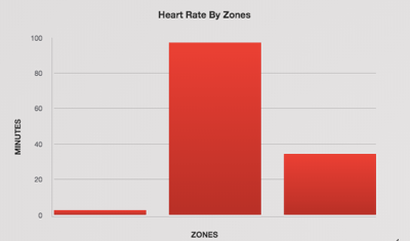
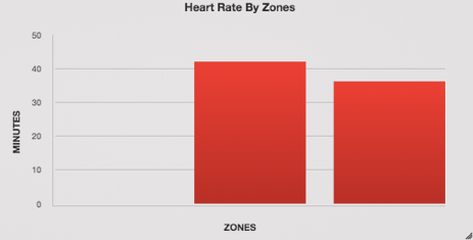
When looking at Figures 3 and 4, keep in mind that the moderate intensity training bandwidth is quite large (145-160 b.min-1 cycling and 150-165 b.min-1 running). The Ironman distance mostly happens in the low end of this bracket (average and max HR for bike and run respectively = 145/157 and 151/163 b.min-1) while the 70.3 distance occurs near the top (154/161 and 164/176 b.min-1)
Pyramidal Model of Training Intensity Distribution
More recently, a number of retrospective studies have put forth another model of TID for cycling, (8) running, (9) and triathlon, (10) termed the “pyramidal” model. Here, most training is still carried out at low intensity, however there are decreasing proportions of threshold and high-intensity training performed. This is a model less discussed that many might not be familiar with. Indeed, we often assume that an athlete who is not polarized in their TID must be in the “threshold” model by default. However, published research has revealed this middle-ground model that we need to appreciate.
Exact defining percentage breakdowns of the Pyramidal model have yet to be clearly established, however this general implies ~25-30% and 5-10% of TID at moderate and high intensity training levels, respectively, with the balance being low intensity training (50-70%). (3) As such, within the pyramidal model of TID, we expect to see less training time at a low and high training intensity, and more time at moderate training intensity. From a specificity standpoint, this middle ground training is much closer to the demands of ironman racing (Figures 3 and 4). Thus, when race day approaches, and training sessions become more “specific” and closer to race intensity, it stands to reason that perhaps the Pyramidal model may particularly suit long course triathletes.
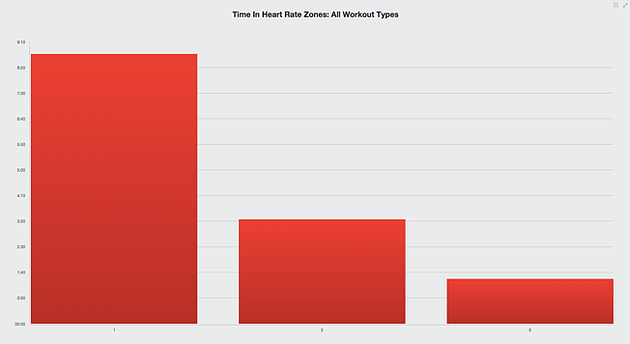
Figure 5, shows my TID during one week in the month of January 2018 (competition phase) before the New Zealand National Middle-Distance Champs. As we can see, my TID certainly fell in line with the Pyramidal model.
Take home points
For Ironman distance racing, or any sport preparation for that matter, we have to consider the principle of specificity. For Ironman, as we are still working in an aerobic event, building aerobic endurance is of key importance. Thus, however you’re skinning it in your Ironman training, a fundamental principle needs to be an aerobic foundation. Ideally, we should be working within a range of TID, that span across the polarized (80/20) and pyramidal (60/40) models, depending on the phase of the training cycle. For example, early season training might look more polarized, while pyramidal may appear to form, as we get closer to racing.
One final point, it that we must also acknowledge the role of athlete health (11) and the stress that training places on the autonomic nervous system (12,13) when substantial amounts of training time are performed above VT1. Thus, future research may want to consider describing the optimal durations of pyramidal and polarized training phases in the diets of Ironman athletes.
References
1. Fiskerstrand A, Seiler KS. Training and performance characteristics among Norwegian international rowers 1970-2001. Scand J Med Sci Sports 2004;14:303-10.
2. Seiler S. What is best practice for training intensity and duration distribution in endurance athletes? Int J Sports Physiol Perform 2010;5:276-91.
3. Stoggl TL, Sperlich B. The training intensity distribution among well-trained and elite endurance athletes. Front Physiol 2015;6:295.
4. Neal CM, Hunter AM, Brennan L, et al. Six weeks of a polarized training-intensity distribution leads to greater physiological and performance adaptations than a threshold model in trained cyclists. J Appl Physiol (1985) 2013;114:461-71.
5. Laursen PB. Training for intense exercise performance: high-intensity or high-volume training? Scand J Med Sci Sports 2010;20 1-10.
6. Seiler KS, Kjerland GO. Quantifying training intensity distribution in elite endurance athletes: is there evidence for an “optimal” distribution? Scand J Med Sci Sports 2006;16:49-56.
7. Plews D, Laursen PB. Training intensity distribution over a four-year cycle in Olympic champion rowers: different roads lead to Rio. International Journal of Sports Physiology and Performance 2017;In Press.
8. Lucia A, Hoyos J, Pardo J, Chicharro JL. Metabolic and neuromuscular adaptations to endurance training in professional cyclists: a longitudinal study. Jpn J Physiol 2000;50:381-8.
9. Esteve-Lanao J, San Juan AF, Earnest CP, Foster C, Lucia A. How do endurance runners actually train? Relationship with competition performance. Med Sci Sports Exerc 2005;37:496-504.
10. Neal CM, Hunter AM, Galloway SD. A 6-month analysis of training-intensity distribution and physiological adaptation in Ironman triathletes. J Sports Sci 2011;29:1515-23.
11. Maffetone PB, Laursen PB. Athletes: Fit but Unhealthy? Sports Med Open 2015;2:24.
12. Plews DJ, Laursen PB, Kilding AE, Buchheit M. Heart-rate variability and training-intensity distribution in elite rowers. Int J Sports Physiol Perform 2014;9:1026-32.
13. Seiler S, Haugen O, Kuffel E. Autonomic recovery after exercise in trained athletes: intensity and duration effects. Med Sci Sports Exerc 2007;39:1366-73


