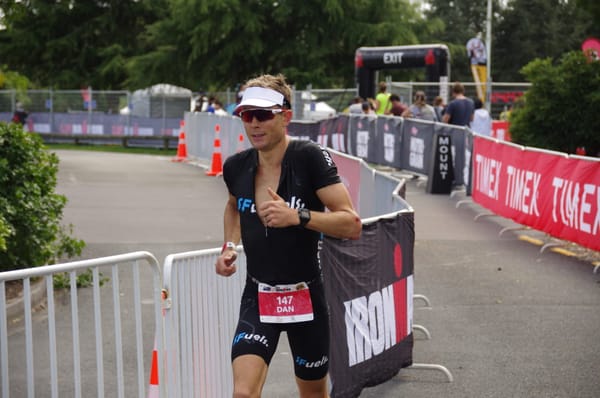
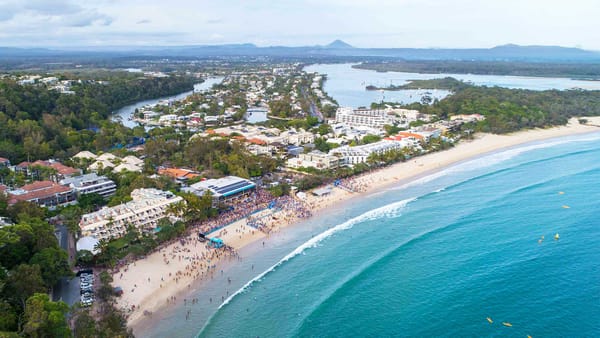
The 3rd March 2018 was a big weekend and a very good one. It marked the 2018 Ironman New Zealand and a race I have had at the forefront of my mind for some time. Traditionally I have always competed in an Ironman race every second year, but this was the first time I had […]
The 3rd March 2018 was a big weekend and a very good one. It marked the 2018 Ironman New Zealand and a race I have had at the forefront of my mind for some time. Traditionally I have always competed in an Ironman race every second year, but this was the first time I had backed up year after year, as I also raced in Ironman New Zealand in 2017. In 2017 the target was to go to Kona and have a good crack, but life can sometimes throw a curve ball, and we were lucky enough to have our first little girl born 1 week early. As luck would have it this was on the actual Kona race day! Kona would have to be postponed to 2018.
The Build Up
Rather than go into lots of details with a race report, I’m sure most are more interested in the prep and the training that occurred before the race. A November to March training summary goes as follows:
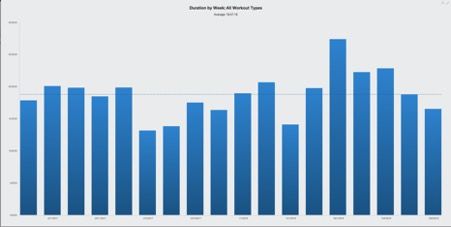
Beginning with the average weekly training hours 18 hr. 47 min. You can see in Figure 1, 5 weeks out from the race I had a good 3-week push. 5 weeks before the race I took some time off work and included two very long rides.
Figure 1: Weekly Training Hours
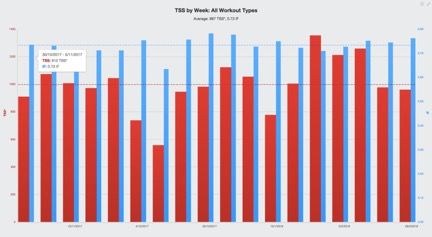
In terms of training load, weekly TSS came up just shy of the 1000 mark (Figure 2). Through experience and working with athletes, I believe that a weekly ~1000 TSS is pretty much “the price of entry” for a good Ironman. With that in mind, it was good to see the final 22 weeks averaged out to this.
Figure 2: Weekly training load (red bars), as measured in TSS via Training Peaks. The blue bar indicates the relative Intensity of each week, as measured by the intensity factor (IF).
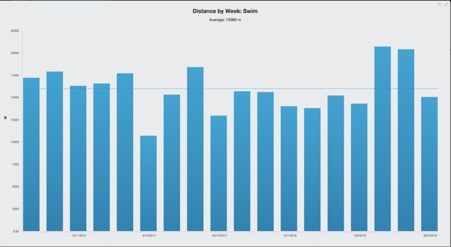
Weekly swim volume came out to just under 16 km per week (Figure 3). This was a little less than I would have liked, and you can see how my swimming took a bit of a dive at around 4-5 weeks before the race. My response to this is shown in the panic 20 k weeks that got included 2 and 3 weeks before the race.
Figure 3: Weekly swim volume in meters.
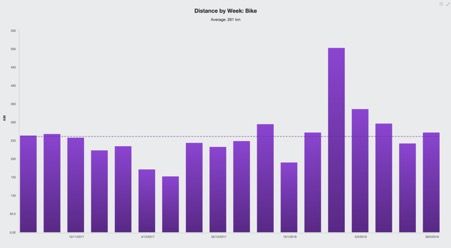
Weekly bike volume came out at 261 km per week (Figure 4). I think cycling is really the area that those of us who are time poor struggle with. This is not a lot of riding. I did, however, have one 500 km riding week 5 weeks before the race that I feel really helped. One of the reasons I believe I got away with such a low volume of riding was because I was very specific with the riding I was doing. Most of my rides were done indoors on my rollers using Zwift.
Figure 4: Weekly bike volume in kilometers.
Finally, the weekly run volume consisted of 60 km per week, with 2 x 83 km run weeks 4 weeks before the race. This involved lots of quality running, including tempo, endurance and long intervals.
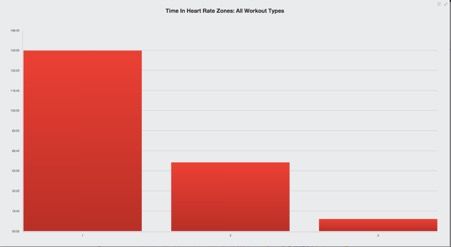
In terms of training intensity distribution, this was well within the pyramidal model as I have talked about. With 69% below LT1, 26% between LT1 and LT2 and 5% above LT2, his certainly has proven to be the best way to distribute training that is specific to the Ironman event in my view.
Figure 5: Training intensity distribution using the three-zone model during the 22 – week build to Ironman Taupo.
The last bit of training was simply awesome, and I was lucky enough to have Jan Van Berkel in town (who I coach). We trained together when we could, and between him, me and Terenzo, we had quite the squad!
Heart Rate Variability
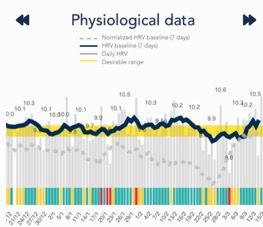
Heart rate variability continues to play an integral part in my preparation. I reported on the HRV responses before last year’s race, and this year was no different. Figure 6 shows my data using the HRV4training Coach App (use referral Plews for 3 months free). You can see the substantial increase in the RMSSD as I absorbed the training during the final block and the decrease back to baseline as I tapered and freshened up before the race. I didn’t have to adjust my training much during the build and the HRV was showing me exactly what I wanted to see. This gives me lots of confidence that everything is going well as race day approaches.
Figure 6: Heart rate variability before the Ironman Taupo 2018. The blue line represents the rolling average and the yellow bar represents cutoffs for substantial (meaningful) increases and decreases in HRV (RMSSD).
Race Day
Race day came, and thankfully the weather gods were with us and put on a stunning day. The swim was flat, and the wind was going to be blowing us home on the from Reporoa during the final sections of the bike leg.
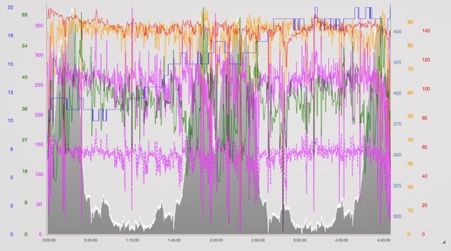
The swim was great and was I excited to exit the water in 50 min just behind the lead AG group athlete. Then I quickly settled into my rhythm on the bike. I was happy to see that the HR was playing ball right from the start, and it dropped to where I wanted it to be very quickly (Figure 7). The average power on the bike was just under 260 w, with an average HR of 142 bpm. With a Power: HR ratio of just 3.25% (i.e. limited decoupling), I was happy with the pacing. Unfortunately, I had a crash with 50 km to go on the bike. Thankfully I just took off some skin, and after a few sore km’s with my hip I loosened up and got back into it. My highest average power for the entire bike came in the final hour (268 w). You can’t beat a good adrenaline rush!
Figure 7: Taupo bike data. The crash can be identified by the heart rate dip just prior to the 3 hr. 30 min mark.
Onto the run, and thankfully the hit my hip had taken on the crash didn’t affect me too much. My aim was to run 4:05 min/km and I managed to pace it quite well:
Distance (km)
Average Pace (min/km)
Average HR
(b.min-1)
Max HR
(b.min-1)
Entire 42.2
4:04
147
155
0-10
4:07
149
154
10-20
4:09
148
154
20-30
4:15
148
154
30-40
4:19
152
155
40-42.2
4:09
148
155
Thanks to the Garmin, the pacing is a little out somewhere (as I ran a 2:52 which is a 4:05). But I’m sure the pacing is telling a story close enough to the truth.
Overall this totalled to an 8 hr. 35 min Ironman, which was easily a personal best time for me. And most importantly I’m now Kona bound!
The day was simply amazing, especially as both Terenzo and Jan also had great days out there as well. There certainly is a reason that Ironman New Zealand has been voted the number 1 Ironman in the world – we’re just so lucky to have it on our doorstep.
Next Steps
Next up is downtime, and most importantly, time to give back to the family! March is a month of rest, and then light training will be beginning in April. In May, Terenzo and I will be going on a 3-week training camp to kick ourselves into form before some of the earlier season races. Can’t wait.
The Journey to Kona will be a great one and I will be working with Trizone giving snippets of where I’m at and what I’ve been up to every 6 weeks. There is a lot going on, so it will certainly be filled with data, training, science, new research and more. I will be also working with Zwift to have some organised group sessions online during some of my key training sessions during the build up.
Dr. Dan Plews has a PhD in Exercise Physiology and has over 30 peer-reviewed publications. His athletes have won world and Olympic titles. He's also the 2018 Ironman Age Group World Champion (8:24:36)