Maximal fat oxidation rates: What does it mean, what does it tell you?
Having a high capacity for using stored fat energy is important for long-distance triathlons, as our stored fat is effectively unlimited during exercise, while stored carbohydrate reserves are finite.


We have discussed in detail that having a robust capacity to use our fat energy stores to support exercise is important for long-distance triathlons. That is because our stored fat is effectively unlimited in the context of exercise, even very long-duration exercise in very lean athletes.
In contrast, our stored carbohydrate reserves are finite and will be depleted to very low concentrations after exercise of sufficient length and intensity.
- Maximal fat oxidation (MFO) rates are a measure of an athlete's ability to use stored fat to fuel exercise.
- MFO rates are calculated through indirect calorimetry, which involves collecting expired gases to estimate the rate at which an athlete consumes oxygen and produces carbon dioxide.
- MFO rates are typically plotted against exercise intensity during an incremental exercise test, with fat oxidation expected to peak at moderate intensities before declining at higher intensities.
- MFO rates do not directly predict fuel use during training or racing, as other factors such as glycogen availability, muscle fiber type, and training history also play a role.
- MFO rates can be influenced by factors such as diet, training, and genetics.
To put this in perspective, a lean, 70-kg triathlete with 10% body fat has at least enough energy in their 7 kg of stored fat to complete more than Ironman triathlons back-to-back (3).
Of course, those are theoretical Ironmans; the point I am making here is that whilst depletion of stored carbohydrates can lead to the fatigue we recognise as ‘hitting the wall’, we don’t slow down in an Ironman because we run out of fat energy (4).
As an exercise physiologist working in applied practice, I regularly test the fat oxidation capacities of endurance athletes in the laboratory during routine physiological profiling assessments. These data, particularly the maximal fat oxidation (MFO) rate observed during an incremental exercise test, provide us with useful information about the athlete in front of us.
However, I feel that the data generated in these assessments is often misinterpreted. Therefore, this blog aims to explain how fat oxidation data is generated in standard physiological profiling assessments, what it tells us, and what it doesn’t tell us.
How the test works
Okay, so firstly, the test itself.
Fat and carbohydrate oxidation rate data is generated through the collection of expired gases using a technique called indirect calorimetry. I won’t dwell on the details here, but by collecting the air an athlete is breathing out, we can estimate the rate at which they consume oxygen and produce carbon dioxide at the whole-body level.
As carbohydrates and fat require different amounts of oxygen and produce different amounts of carbon dioxide in their breakdown, we can use these data to estimate the contributions of carbohydrates and fat to overall energy expenditure during the collection period. The picture at the top of this feed is a picture of Javier doing one of these tests in our Lab at AUT University.
Suppose we collect expired gases during a standard incremental exercise test, in which the power output or running speed starts at a very easy intensity but progresses to become harder and harder. In that case, we can calculate carbohydrate and fat oxidation rates across a range of different intensities.
It is important that the stages are long enough for the expired gas data to stabilise to produce valid estimates; we prefer to use stages of at least 4 min in length.
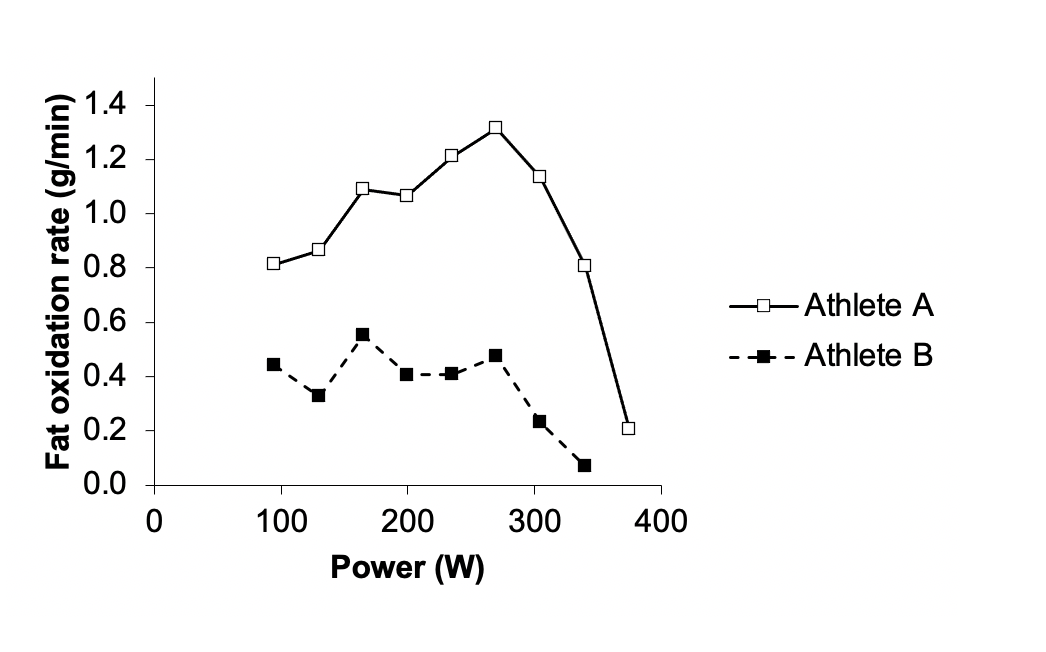
We expect to see fat oxidation rates initially rise as exercise intensity increases from low to more moderate intensities, peaking near the first threshold before declining at higher intensities, where we become more dependent on carbohydrate metabolism to fuel exercise (7). We plot and assess this relationship as a key outcome measure in our routine tests (5). Fat oxidation profiles can look very different between athletes (see below).
What the data doesn’t tell you.
So, we generate and plot carbohydrate and fat oxidation rates for various power outputs or running speeds using indirect calorimetry data collected during routine physiological profiling assessments. These data are super useful, but it is important first to recognise what the data doesn’t tell you.
The data doesn’t tell you exactly how much carbohydrate and fat you’ll be oxidising at a given intensity during racing or even training; fuel use is impacted by many factors, including recent nutrition, environmental temperature, and exercise duration (8). These tests are, for example, often conducted after an overnight fast, which results in higher fat oxidation rates than exercise performed after breakfast (1). They’re usually conducted in air-conditioned laboratories, where the cool temperature will likely result in higher fat oxidation rates than during exercise in hot environments – like Kona (2). Fat oxidation rates will also progressively increase over time during long-duration exercise as your carbohydrate availability gradually dwindles (9).
The data therefore cannot tell you exactly how much carbohydrate you’ll need to take on in drinks and gels to mitigate your chances of bonking with any real accuracy. That is, if your carbohydrate oxidation rate is 1.6 grams per minute at 200 W during a physiological profiling assessment, that does not mean you will be metabolising carbohydrates at a rate of exactly 1.6 grams per minute throughout a four-hour long training ride, or during your competition.
What the data does tell you.
So, if the data can’t tell you exactly how many carbohydrates and fat you’ll be burning at given workloads in training and competition, what does it tell you?
For me, a controlled assessment in the laboratory, where the athlete conducts the test in a well-rested state after an overnight or > 4-hour fast, gives us a good indication as to whether they have a robust, moderate, or poor capacity for fat oxidation during exercise. The primary value generated in the test I use to make this assessment is the highest value, or the maximal fat oxidation (MFO). In the graph above, this would be ~1.4 grams per minute for Athlete A and ~0.55 grams per minute for Athlete B. We previously published normative values for MFO (5), which you can view open-access here.
This assessment – marking an athlete as a robust, moderate, or poor fat burner based on MFO - is fair, as we recently reported a very strong relationship between MFO, measured during a fasted, incremental cycling test, and the average fat oxidation rate during a two-hour long ride taking place after breakfast, with carbohydrate feeding throughout (6). So, we can say those with the highest MFO will metabolise more fat during exercise in more ecological-valid scenarios reflective of real-world training and competition.
In our courses and previous blogs, I have explained why this is important – but it is worth stating again here that having a robust capacity to make use of fat as a fuel source during exercise reduces the burden placed on those finite stored carbohydrates and therefore maintains carbohydrate availability and delays fatigue. The study I mentioned asked the participants to perform a 30-min time-trial after the two-hour long ride, and positive relationships were observed between MFO and time-trial performance. Perhaps more importantly, adding MFO to traditional endurance performance parameters – V̇O2max, thresholds, and efficiency – improved the fit of these models and better-explained performance. We took this as evidence that MFO is a useful endurance performance parameter, supporting its consideration in physiological profiling assessments (6).
Alongside the peak value, I also look at the fat oxidation rate at and close to the first threshold – VT1, LT1, or the moderate-to-heavy transition. That tells us whether the athlete retains that robust/moderate/low-fat oxidation capacity at ‘competitive’ type intensities likely to be undertaken during a long-distance triathlon and most training sessions. Some athletes display decent peaks at very low intensities but retain little fat oxidation capacity at more steady intensities around that first threshold. I, therefore, take this under advisement when assessing the individual athlete’s profile.
Collectively, these data inform me of a few key takeaway points:
- How aggressive the athlete might need to be in terms of carbohydrate feeding. While we recommend consuming carbohydrates at decent rates for all athletes during competition – even those with robust MFO of >1 gram per minute – we might need to be more aggressive with poorer fat burners and consider things like glucose-fructose blends. But as discussed before, there are better solutions for consistent performance and better health.
- How the athlete has responded to diet and training interventions. If we have gone through a block of base work in which we hope to see an increased capacity for fat oxidation during exercise, we can assess this using these data.
- How the athlete is likely to perform. As indicated above, alongside traditional metrics, MFO helps build models of endurance performance.
Summary
Therefore, the main message I am trying to get across in this blog is this: When looking at fat oxidation profiles generated during incremental exercise tests, try not to overinterpret the data; instead, use it to determine if the athlete is a robust, moderate, or poor burner during exercise, and how that has changed over time. You can then use that knowledge to inform your future training objectives.
Written by