My Training Numbers to 8:24 at the 2018 Ironman World Championship
A detailed account of my Ironman World Championships 2018 winning performance, highlighting the effective strategies, high consistency, and intense training volume behind a new age-group course record.
It’s been a while! After sharing my training for the 2018 Taupo Ironman, which was well received, I thought it was about time to do the same for the magical day I had in Kona on October 13th, 2018.
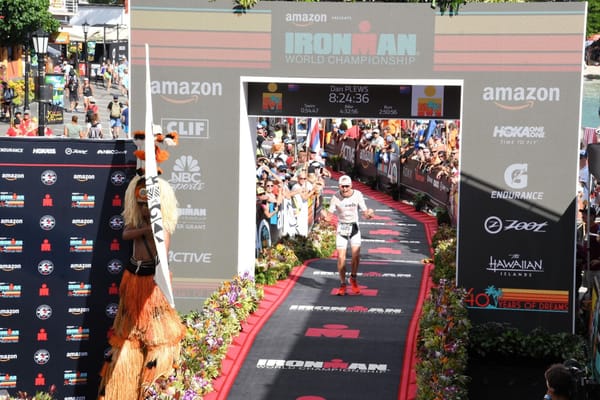
Kona 2018 Ironman World Championships sure was one to remember, winning the age-group race overall and breaking the age-group course record in 8:24:36.
I never wrote a detailed race report, however, I wrote a post shortly after the race called Kona Gems and also talked about the race itself on a number of podcasts such as Fitter Radio, Triathlon Taren, Swim Smooth and Oxygen Addict. At the end of the day, it’s all about the process. So below are some of the “nitty and gritty” training data during my build to the Ironman World Championships. The training data below starts from April 2nd, which is just after a 3-week break post-Ironman New Zealand (28 weeks).
Overall Training Volume and Load
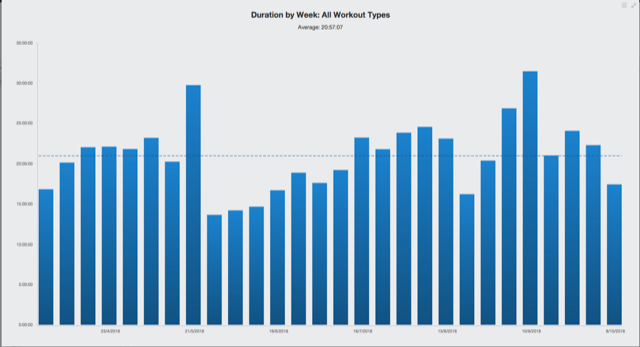
My weekly average training was just under 21 hours (20 hrs 57 min), this was slightly more than for Taupo 2018 which was just under 19 hrs. A couple of training camps in May and September helped bump up this average, this is the significant difference between the two races. Both of these training camps were around 30 hours of training weeks.
Figure 1: Total weekly training hours during the build to Kona (28 weeks)
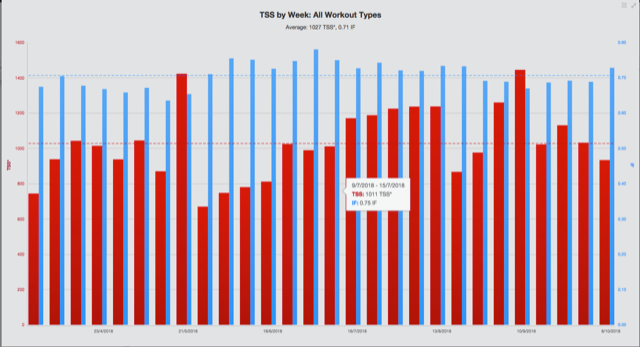
Training load, (Training stress score TSS – Training Peaks), was just over the 1000 TSS (1027). This shows how consistent the training was for the entire 28-week period. As I mentioned before in other posts, I believe a TSS of 1000 is the price of entry for a top age-group Ironman performance. More importantly, consistency is everything.
Figure 2: Weekly training load (red bars), as measured in TSS via Training Peaks. The blue bar indicates the relative intensity of each week, as measured by the intensity factor (IF).
You can see in Figure 1 the higher load training blocks were quite some time before the race (from 9-13 weeks). This is an essential consideration for racing in Kona when the conditions are extreme. When racing in the heat, it’s better to get the work done early and be fresher on race day.
Swimming Numbers
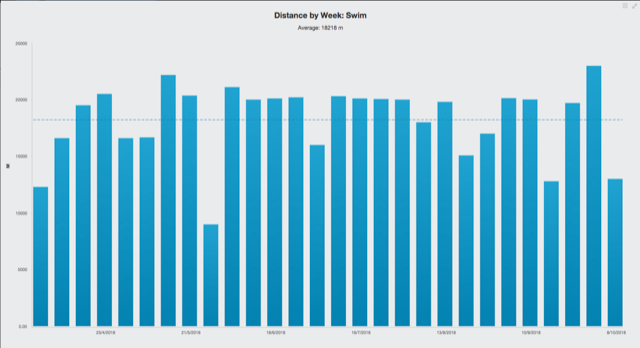
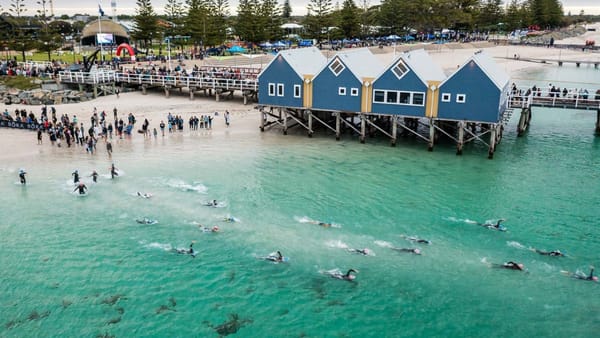
Knowing that Kona is a non-wetsuit swim, I purposely pushed the swim fitness so the 3.8km would take very little out of me. Weekly swimming volume was 18.2 km, aiming for ~20 km most weeks (Figure 3). For “non-swimmers” like myself, I find keeping a high and consistent weekly swimming volume is vital. These were 5 swims consisting of 1 x endurance (5 k), 1 x threshold (5 k), 1 x strength (5 k), 1 x speed (3 k) and 1 x technique/recovery (2 k).
Figure 3: Weekly swim volume in metres.
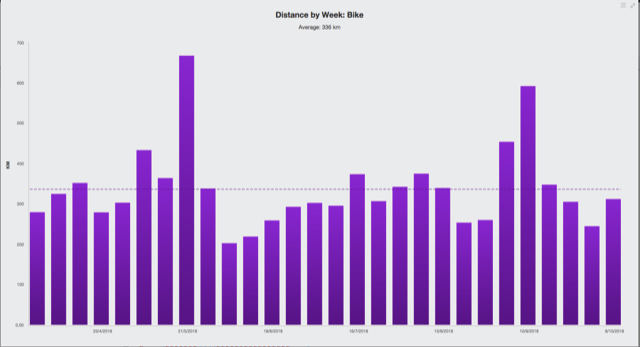
Bike Numbers
The weekly bike volume higher averaged out to be 336 km (Figure 4). Although more than Ironman NZ, this volume still isn’t massive. As I’m time poor (juggling, work, family and training), I emphasize quality over quantity for riding. All but 1 of my rides was carried out inside using Zwift. Every bike session was targeted and very specific.
Figure 4: Weekly bike volume in kilometres.
In Figure 4, you can quickly notice the standout bike volume weeks — one in May when I was injured for running, and the other on a training camp in September. These two short blocks stepped up the cycling, and I believe them to be critical to my bike form come race day. Every misfortune creates an opportunity, and the 667 km cycling week in May is a great example of that.
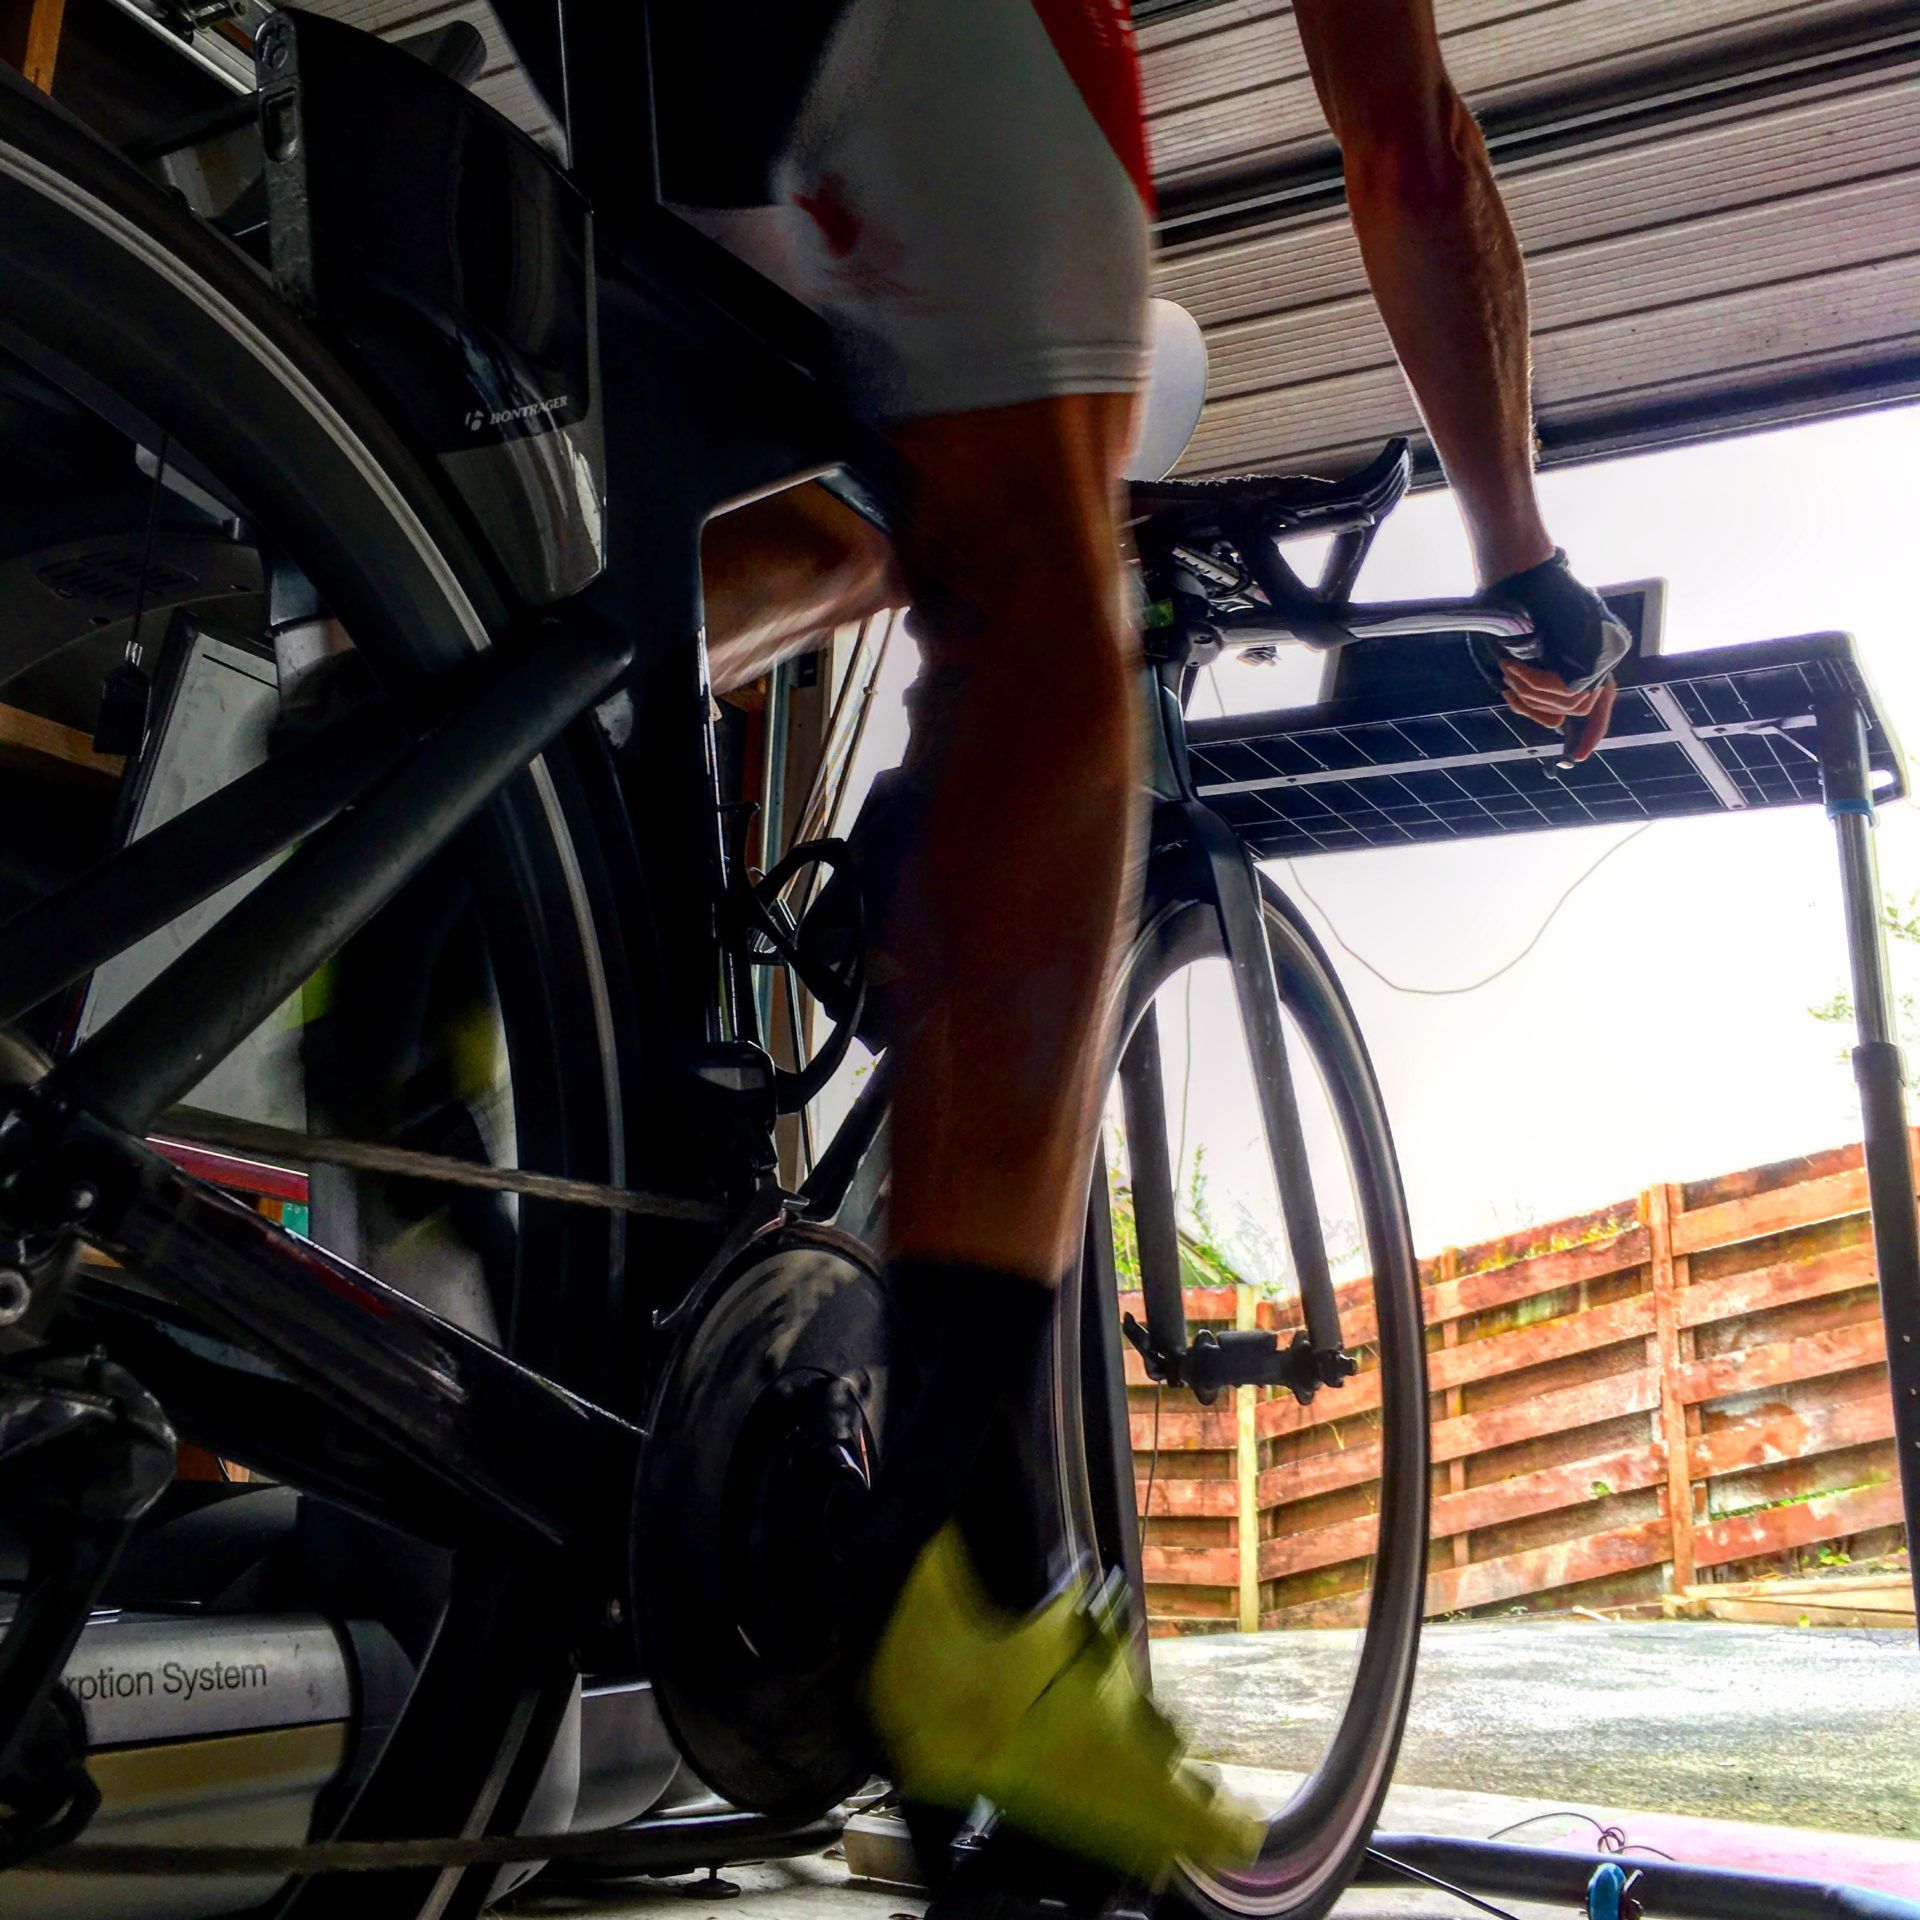
Plenty of time spent in my garage during the New Zealand winter! Rollers + Zwift!
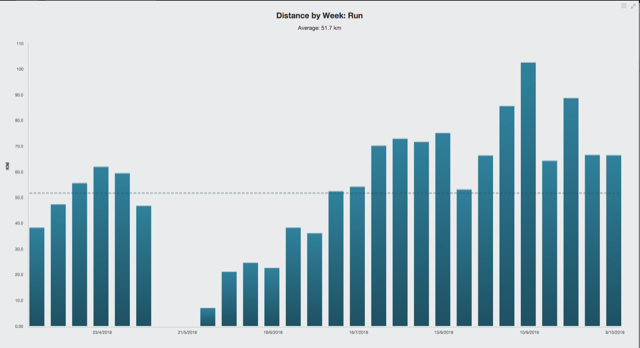
Run Numbers
For the running, the weekly volume was 51.7 km. Figure 5 shows why this is the case. I literally did no running at all for 1-month May-June due to injury. Given my run form on Kona race day (2 hr. 50 min marathon and 5th fastest overall) this statistic even surprised me a little. It goes to show, you don’t need a huge run mileage if other things are in place (diet and training content).
Figure 5: Weekly running volume in kilometres
After some careful planning and gradual re-introduction to running, I maintained a high running volume for quite some time. From July 23rd until race day, my weekly amount was 73.6 km with one 103 km week in early September. As with the biking, lots of quality was included here. Despite one long run, the rest consisted of plenty of tempo and off the bike (often treadmill) runs.
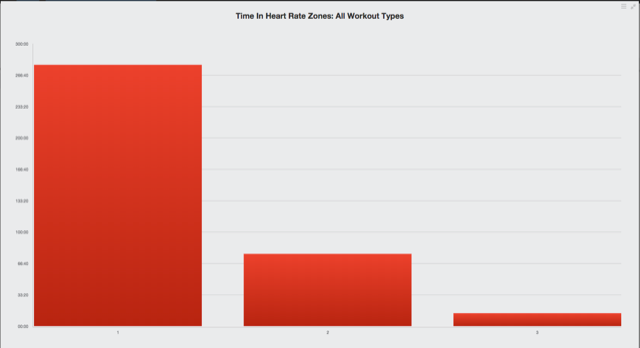
Training Intensity Distribution
The training intensity distribution (TID) was again closer to the pyramidal model of TID than polarized. However, more at a lower intensity < 1st aerobic threshold than compared to my Ironman Taupo build, with 75.2% <LT1, 21% between LT1 and LT2 and 3.8% >LT2 (comparatively IM NZ was 69/26/5%). Accordingly, the additional overall volume regarding hours came with extra low-intensity training (<LT1), rather than high intensity (>LT2). Time below LT1 (in line with MAF method) is once again critical for health, performance and optimizing fat burning. With 75% of training below LT1, there is plenty of time to promote high-fat oxidation. This is why it makes much more sense for Ironman to maintain a low carbohydrate diet long term, and introduce carbohydrate as (if) needed, rather than vice versa.
Figure 6: Training intensity distribution using the three-zone model during the 28-week build to Kona World Ironman Championships.
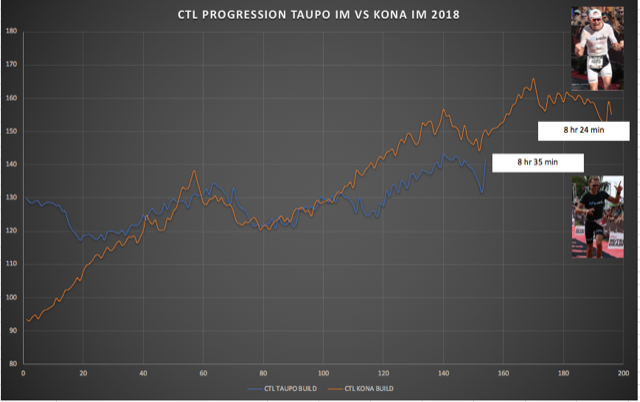
Finally, for the chronic training load (CTL, a marker of “fitness”), the number in race day was 150. The highest (mid-September) was 162. When CTL is high (i.e. >135), I discovered that a reasonable drop before racing is essential (and try to accomplish this in many pros I coach). It’s a critical factor to a good taper due to higher chronic fatigue. Figure 7 shows my CTL build comparative to Taupo. It’s obvious how the training camp in September really helped and was perfectly timed.
Figure 7: Chronic Training Load (CTL) builds. Taupo vs Kona Ironman races 2018
What was the difference?
When looking at the data above, the swimming, cycling and running volume isn’t that high, nor is the overall volume. The total volume is reasonably high, but the main point of difference is consistency and a continuously high training load. During these 28 weeks, not only was the average TSS >1000, but the variation (as a coefficient variation) from week to week was just 19% (SD = ± 196 TSS). If there was one thing that I believe to be the cornerstone of any Ironman training program, it’s the consistency of training. Consistent training isn’t easy to do of course, but with a balanced training program (high intensity vs low intensity), careful monitoring (e.g. HRV), and a healthy diet (lower in sugar/refined carbohydrate and high in good fats) it’s more likely to be achieved. The latter (diet), from my perspective, is very important for a variety of reasons (both training and performance). However, the problem is in its practical execution that very few understand. I felt Triathlon Taren summarized the problem well in this video (4 min 40 sec in). LCHF diet executed correctly is a real game changer for most athletes. Undeniably, having a high-fat oxidation for ultra-endurance sports in imperatively important.
What’s next?
Serious racing for 2019 is off the table for the time being. I continue to LOVE training. I also have to keep up with Terenzo Bozzone when I do train, so keeping some level of fitness is a necessity! The main focus in 2019 is to help those who want to make inroads to their Ironman triathlon performance.
Dr. Dan Plews has a PhD in Exercise Physiology and has over 30 peer-reviewed publications. His athletes have won world and Olympic titles. He's also the 2018 Ironman Age Group World Champion (8:24:36)